Hi all! My miab has been running fine for ages. Recently, I had issues sending and receiving email all of a sudden. I thought that the easiest solution might just be to reinstall miab and restore from backup.
I naively did so. After running into some issues with the installation script (solved by this), I finally got everything running again. One thing I had noticed going back and forth was that my cloud provider (noez.de) was showing a whopping 500 GB of data transfer used this month.
Next, I ran into weird issues with munin. It was listing more than 200 storage devices named dm1 through dm232. I thought: well, maybe an issue with my VPS provider’s setup. I disabled munin, because it was using up a lot of system resources and I don’t really use it at all.
Then, I noticed that there were a bunch of odd ssh requests to my server. It is properly set up to only accept my private key for authentication, and I am hoping that I kept this key reasonably safe (no copies anywhere but on a flash drive in my desk drawer). I used fail2ban to ban these.
What I am still not so sure about is a bunch of agetty processes showing up. Also, I found one actual connection (or so it seemed) via ssh from 2.57.122.249. I ended that process and added the IP to the sshd jail in fail2ban.
Is it reasonable to assume that my box was the target of a successful attack?
How can I ensure that this attack is no longer going on?
Do I need to reinstall my box without restoring from my backups assuming that these are compromised as well?
“auth.log” (and the older files .1 etc) shows all logins and login attempts - lines starting “box sshd” are attempts to remotely login, if things are going well that message will be followed by a “connection closed” line; a “session opened for user” line means someone/something logged in!
“‘syslog’” and “‘mail.log’” are also very useful.
I’d run the command “sudo sshd -T | grep password” - the config output should say “no” on each line. If it says “yes” then you have a system open to easy attacks. (It might be time to reset all passwords to random strings, difficult to guess.)
I’d also re-enable munin and check the results very regularly. I found it helpful to add the file /etc/munin/plugin-conf.d/zzz-myconf with the following contents:
[diskstats]
env.include_only sd
Replace “sd” with whatever your real disk devices are named. Then run “service munin-node restart”.
Check the number of logged in users. But the correct number of user logins should be zero, apart from when you login yourself.
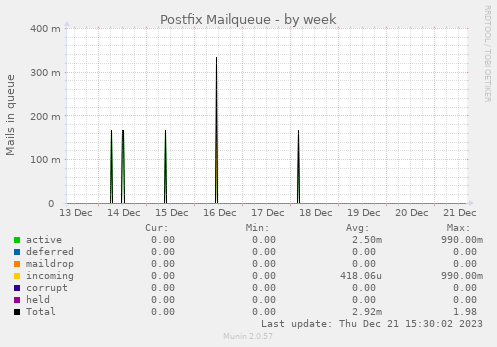
Check the size of the mail queue, and look for any sudden ongoing changes in network traffic. Normal traffic and mail queue size will depend on how many active users you have, so I can’t suggest any “correct” numbers.
It’s possible the ssh connection you were seeing was just someone attempting to log in by guessing at passwords. On my server I see a regular cadence of failed ssh auth attempts in the logs. There are a lot of automated systems out there just looking for open ports and attempting to find a way into servers through those open ports. Port 22 is a popular target.
Whenever I log into my system I usually run the following two commands just as a check: “w” and “last”. “w” shows you who is logged onto the system currently. “last” shows a list of logins to the system and the IP address the login came from, if it came from an external source. You can review the “last” list and see if there have been any successful logins from unknown IP addresses.
Thanks for your advice! I have checked most of these things and nothing suspicious came up.
As for the storage thing, lsblk gives me
NAME   MAJ:MIN RM  SIZE RO TYPE MOUNTPOINTS
sda      8:0    0  3.6T  0 disk
|-sda1   8:1    0 1007K  0 part
|-sda2   8:2    0    1G  0 part
`-sda3   8:3    0  3.6T  0 part
sdb      8:16   0  3.6T  0 disk
|-sdb1   8:17   0 1007K  0 part
|-sdb2   8:18   0    1G  0 part
`-sdb3   8:19   0  3.6T  0 part
which is odd, since I am actually paying for a mere 20 GB. Maybe I should rather be taking this to my VPS provider. I am assuming that munin slowed down my system by so much simply because it was tracking and rendering stats for all 232 storage devices it had found.
I will give you an update once anything else comes up.
so, something still seems to be going on. I am the only user on my box and send/receive normal amounts of email. Today, I received a message from my VPS provider, that I have eaten through another 250 GB of traffic. What is going on?
Also, I see plenty of these in my /var/log/mail.log:
Dec 18 20:49:15 box postfix/smtpd[1361087]: connect from ***.dip0.t-ipconnect.de[***.***.***.***]
Dec 18 20:49:15 box postfix/smtpd[1361087]: NOQUEUE: reject: RCPT from ***.dip0.t-ipconnect.de[***.***.***.***]: 450 4.1.8 <root@***.fritzbox.local>: Sender address rejected: Domain not found; from=<root@***.fritzbox.local> to=<f@***.**> proto=ESMTP helo=<***.fritzbox.local>
Dec 18 20:49:15 box postfix/smtpd[1361087]: disconnect from ***.dip0.t-ipconnect.de[***.***.***.***] ehlo=1 mail=1 rcpt=0/1 data=0/1 rset=1 quit=1 commands=4/6
Have you changed all passwords to make them very strong? (That is all users on the box, and all mail users.) If someone guessed a password, they may be using your box to send spam!
Did you change anything from the standard MIAB config? The standard config is pretty good - if you opened anything up, you might have permitted third parties to do untoward things on your box.
Did this for now. My current working hypothesis is that somebody was sending out thousands of newsletter subscription requests by abusing a listmonk form tied to this box. Turned listmonk off and will see if that changes anything. Still, I am getting thousands of requests for ssh connections. Fortunately, my ssh only accepts my private key and I took good care of keeping it secret. Will see how this develops now, listmonk might be an easy explanation.
also nothing changed from standard config except for using a key to access spamhaus, but that’s really just adding some text to the spamhaus domains. But this box has been going for a while, there is a slight chance that I changed something and forgot about it
That’s how it looks to me. Clearly someone is messing with you. What do you use MiaB for? By that I mean, do you run a business? Just use if for personal email? Etc. I ask because your options for mitigation vary widely based on that. At a minimum, I would try to figure out the IP where those thousands of ssh connections are coming from and the IP responsible for these millions of emails and start creating a firewall rules to block entire CIDRs. And wait to see if things quiet down a bit. Just a thought.
Mine doesn’t show that, but it’s probably because I get more traffic. I think @KiekerJan is right. I’ve seen that before on Munin graphs where the ‘m’ means milli.
I don’t think the mail queue graph shows how much mail you’ve sent or received. It’s telling you how many emails are queued to be processed. it’s partial because it’s probably applying an averaging function.
Mine is the same. It is mili or 1000 mili is 1 email. I am not sure what is eating up so much bandwidth but did you run top. Are there any unusual processes such as a tor server or anything not related to the SMTP server that could devour so much bandwidth?